GT 5.1 Strategy═════════════════════════════════════════════════════════════════════════
█ OVERVIEW
People often look an indicator in their technical analysis to enter a position. We may also need to look at the signals of one or more indicators to verify the signals given by some indicators. In this context, I developed a strategy to test whether it really works by choosing some of the indicators that capture trend changes with the same characteristics. Also, since the subject is to catch the trend change, I thought it would be right to include an indicator using the heikin ashi logic. By averaging and smoothing the market noise, Heiken Ashi makes it easier to detect the direction of the trend helps to see possible reversal points on the chart. However, it should be noted that Heiken Ashi is a lagging indicator.
I picked 5 different indicators (but their purpose are similar) and combined them to produce buy and sell signals based on your choice(not repaint). First of all let's get some information about our indicators. So you will understand me why i picked these indicators and what is the meaning of their signals.
1 — Coral Trend Indicator by LazyBear
Coral Trend Indicator is a linear combination of moving averages, all obtained by a triple or higher order exponential smoothing. The indicator comes with a trend indication which is based on the normalized slope of the plot. the usage of this indicator is simple. When the color of the line is green that means the market is in uptrend. But when the color is red that means the market is in downtrend.
As you see the original indicator it is simple to find is it in uptrend or downtrend.
So i added a code to find when the color of the line change. When it turns green to red my script giving sell signals, when it turns red to green it gives buy signals.
I hide the candles to show you more clearly what is happening when you choose only Coral Strategy. But sometimes it is not enough only using itself. Even if green dots turn to red it continues in uptrend. So we need a to look another indicator to approve our signal.
2 — SSL channel by ErwinBeckers
Known as the SSL , the Semaphore Signal Level channel is an indicator that combines moving averages to provide you with a clear visual signal of price movement dynamics. In short, it's designed to show you when a price trend is forming. This indicator creates a band by calculating the high and low values according to the determined period. Simply if you decide 10 as period, it calculates a 10-period moving average on the latest 10 highs. Calculate a 10-period moving average on the latest 10 lows. If the price falls below the low band, the downtrend begins, if the price closes above the high band, the uptrend begins. Lets look the original form of indicator and learn how it using.
If the red line is below and the green band is above, it means that we are in uptrend, and if it is on the opposite side, it means that we are in downtrend. Therefore, it would be logical to enter a position where the trend has changed. So i added a code to find when the crossover has occured.
As you see in my strategy, it gives you signals when the trend has changed. But sometimes it is not enough only using this indicator itself. So lets look 2 indicator together in one chart.
Look circle SSL is saying it is in downtrend but Coral is saying it has entered in uptrend. if we just look to coral signal it can misleads us. So it can be better to look another indicator for validating our signals.
3 — Heikin Ashi RSI Oscillator by JayRogers
The Heikin-Ashi technique is used by technical traders to identify a given trend more easily. Heikin-Ashi has a smoother look because it is essentially taking an average of the movement. There is a tendency with Heikin-Ashi for the candles to stay red during a downtrend and green during an uptrend, whereas normal candlesticks alternate color even if the price is moving dominantly in one direction. This indicator actually recalculates the RSI indicator with the logic of heikin ashi. Due to smoothing, the bars are formed with a slight lag, reflecting the trend rather than the exact price movement. So lets look the original version to understand more clearly. If red bars turn to green bars it means uptrend may begin, if green bars turn to red it means downtrend may begin.
As you see HARSI giving lots of signal some of them is really good but some of them are not very well. Because it gives so much signals Now i will change time period and lets look same chart again.
Now results are better because of heikin ashi's logic. it is not suitable for day traders, it gives more accurate result when using the time period is longer. But it can be useful to use this indicator in short time periods using with other indicators. So you may catch the trend changes more accurately.
4 — MACD DEMA by ToFFF
This indicator uses a double EMA and MACD algorithm to analyze the direction of the trend. Though it might seem a tough task to manage the trades with the help of MACD DEMA once you know how the proper way to interpret the signal lines, it will be an easy task.
This indicator also smoothens the signal lines with the time series algorithm which eventually makes the higher time frame important. So, expecting better results in the lower time frame can result in big losses as the data reading from the MACD DEMA will not be accurate. In order to understand the function of this indicator, you have to know the functions of the EMA also.
The exponential moving average tends to give more priority to the recent price changes. So, expecting better results when the volatility is very high is a very risky approach to trade the market. Moreover, the MACD has some lagging issues compared to the EMA, so it is super important to use a trading method that focuses on the higher time frame only. What does MACD 12 26 Close 9 mean? When the DEMA-9 crosses above the MACD(12,26), this is considered a bearish signal. It means the trend in the stock – its magnitude and/or momentum – is starting to shift course. When the MACD(12,26) crosses above the DEMA-9, this is considered a bullish signal. Lets see this indicator on Chart.
When the blue line crossover red line it is good time to buy. As you see from the chart i put arrows where the crossover are appeared.
When the red line crossover blue line it is good time to sell or exit from position.
5 — WaveTrend Oscillator by LazyBear
This is a technical indicator that creates high and low bands between two values. It then creates a trend indicator that draws waves with highs and lows within these boundaries. WaveTrend is a widely used indicator for finding direction of an asset.
Calculation period: number of candles used to calculate WaveTrend, defaults to 10. Averaging period: number of candles used to average WaveTrend, defaults to 21.
As you see in chart when the lines crossover occured my strategy gives buy or sell signals.
═════════════════════════════════════════════════════════════════════════
█ HOW TO USE
I hope you understand how the indicators I mentioned above work and what they are used for. Now, I will explain in detail how to use the strategy I have created.
When you enter the settings section, you will see 5 types of indicators. If you want to use the signals of the indicators, simply tick the box next to the indicators. Also, under each option there is an area where you can set the "lookback". This setting is a field that will make the signals overlap when you select more than one option. If you are going to trade with only one option, you should make sure that this field is 0. Otherwise, it may continue to generate as many signals as you choose.
Lets see in chart for easy understanding.
As you see chart, if i chose only HARSI with lookback 0 (HARSI and CORAL should be 1 minumum because of algorithm-we looking 1 bar before, others 0 because we are looking crossovers), it will give signals only when harsı bar's color changed. But when i changed Lookback as 7 it will be like this in chart.
Now i will choose 2 indicator with settings of their lookback 0.
As you see it will give signals when both of them occurs same time. But HARSI is an indicator giving very early signal so we can enter position 5-6 bars after the first bar color change. So i will change HARSI Lookback settings as 7. Lets look what happens when we use lookback option.
So it wil be useful to change lookback settings to find best signals in each time period and in each symbol. But it shouldnt be too high. Because you can be late to catch trend's starting.
this is an image of MACD and WAVE trend used and lookback option are both 6.
Now lets see an example with 3 options are chosen with lookback option 11-1-5
Now lets talk about indicators settings. After strategy options you will see each indicators settings, you can change their settings as you desired. So each indicators signal will be changed according to your adjustment.
I left strategy options with default settings. You can change it manually as if you want.
═════════════════════════════════════════════════════════════════════════
█ LIMITATIONS: Don't rely on non-standard charts results. For example Heikin Ashi is a technical analysis method used with the traditional candlestick chart.Heikin Ashi vs. Candlestick Chart: The decisive visual difference between Heikin Ashi and the traditional chart is that Heikin Ashi flattens the traditional candlestick chart using a modified formula.
The primary advantage of Heikin Ashi is that it makes the chart more reader-friendly and helps users identify and analyze trends .
Because Heikin Ashi provides averaged price information rather than real-time price and reacts slowly to volatility — not suitable for scalpers and high-frequency traders. I added HARSI indicator as a supportive signal because it is useful with using CORAL and SSL channel indicators. If you change your candle types to Heikin Ashi , your profit will change in good way but dont rely on it.
═════════════════════════════════════════════════════════════════════════
█ THANKS:
Special thanks to authors of the scripts that i used.
@LazyBear and @ErwinBeckers and @JayRogers and @ToFFF
═════════════════════════════════════════════════════════════════════════
█ DISCLAIMER
Any trade decisions you make are entirely your own responsibility.
在脚本中搜索"wave trend"

ZigZag WavesHello All,
I am here with a new idea and script, " Zigzag Waves ". This indicator creates 3 Zigzags with different lengths, keeps the lengths of each zigzag wave and calculates/draws average waves for each zigzag. optionally it can reset the wave when zigzag direction changes and new highest/lowest found. And optionally it draws Exponential Moving Average(EMA) of the sum of waves. This idea is very new and at the moment there is no optimization for the Zigzag Periods. Maybe we altogether can improve the idea and find the best zigzag periods for different symbols and time frames.
Using the options You can play with the periods, add/remove EMA, set its color and reset the waves on new Highest/Lowest. As far as I see resetting the waves on new Highest/Lowest may bring better results.
if we enable "Reset the waves on new Highest/Lowest":
Using different periods and EMA length:
P.S. if you have ideas to improve this script, drop a comment under the script please.
Enjoy!

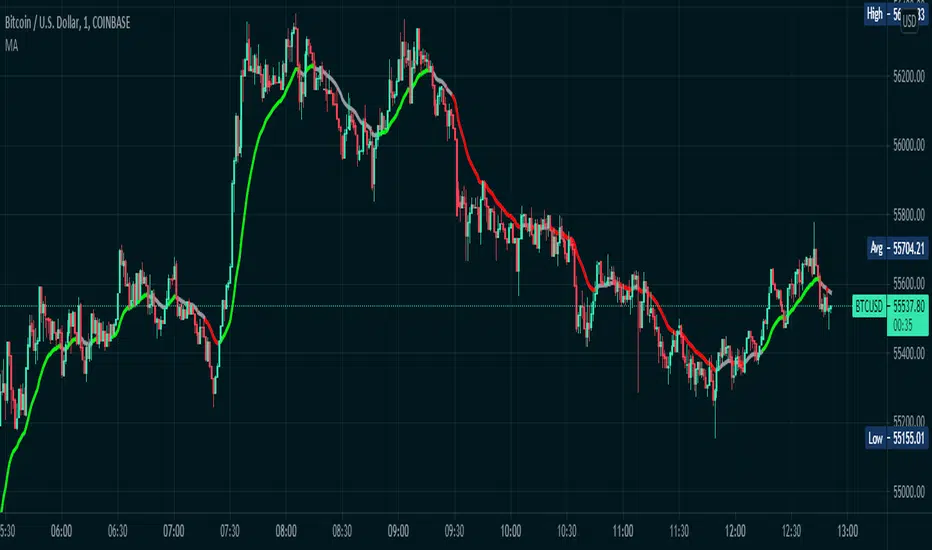
Color Changing Moving Average
Hello everybody!
I'm not much of a coder but I do make indicators for myself for fun sometimes and found this one super cool. Hope it helps!
Basically it's a moving average that changes colors based on the trend. How does it do it, you may ask? Simply put, it checks and makes sure that the open and close price is above the moving average, then it checks and sees if the 50-period RSI (length adjustable) is above 50. If both conditions are met, the moving average turns green. Simple as that.
If the price is below the moving average and the RSI is below 50, the moving average turns red.
If the price is above the moving average but the RSI is below 50, the line is grey and I advise to simply waiting for the trend direction to be decided. Likewise, if the price is below the moving average, but the RSI is above 50, the line is also grey.
This is NOT a comprehensive system, and the changing color of the moving average does not indicate a buy or sell signal. It simply indicates that the price is trending. You should use your own entry and exit strategy, such as the MACD, Wave Trend, Schaff Trend Cycle, etc.
As well, I would recommend waiting for confirmation of a trend change when the color changes, since in a range price can cross multiple times before deciding on the right direction.
The slope of the moving average can help too, since in a range the moving average is typically flat.
I would recommend using a fixed risk to reward ratio, to limit emotions. But, this would also help with a trend-following strategy due to the trend filter functionality.
The length of the moving average is adjustable, as well as the RSI period- though I wouldn't recommend selecting an RSI lower than 30 because it will whipsaw more. Disabling the EMA option will give you an SMA that does the same thing as the EMA. You can also disable the RSI filter and simply have a moving average that changes color when the price is above/below- but that's pretty boring, huh?
Anyways, hope this helps, happy trading everybody :)
[blackcat] L1 Whale Jumping out of the OceanLevel: 1
Background
One of the biggest differences between cryptocurrency and traditional financial markets is that cryptocurrency is based on blockchain technology. Individual investors can discover the direction of the flow of large funds through on-chain transfers. These large funds are often referred to as Whale. Whale can have a significant impact on the price movements of cryptocurrencies, especially Bitcoin . Therefore, how to monitor Whale trends is of great significance both in terms of fundamentals and technical aspects.
We often see whales suddenly jump out of the ocean and then set off huge waves. What we need to do is to surf the wave according to the trend after the whale jumps out of the sea. This is really an exciting sport!
Function
By modeling the behavior of Whale and individuals (Surfers), L1 Whale Jumping out of the Ocean can not only simply describe the behavior trends of Whale and individuals, but also describe the shape of waves generated by the whale jump. Individual traders need to follow the wave trend to take profit.
NOTE: white line and yellow candles represent whale appears but it CANNOT indicate the direction as PUMP or DUMP. This indicator is one of the whale series. It is featured by vividness. A technical indicator is drawn as ocean (momentum in blue and aqua), whale (whale PUMP/DUMP in white,yellow, red, fuchsia and green), huge wave (mid-term trend or swing trend in aqua and blue).However, it does not accurately generate buying and selling points.
Key Signal
var01 --> huge wave caused by whale jump. it is used to confirm whale jump and describe the trend of wave for surfers.
var02 --> whale move signal
var12 --> whale move signal
var28 --> high confidence level of huge whale move
dynabot --> deep ocean (dynamic bottom)
Pros and Cons
Pros:
1. Detect Whale pump and dump and the strength of huge wave.
2. Vividly compare the market movement to a huge wave caused by a whale jumping out of the sea.
3. When it resonante with buy or sell signal from other independent indicators, it has higher confidence level.
Cons:
1. No exact long and short entries.
2. It is sensitive and may have noise inside and generate fake entry signal.
Remarks
Please do not think that this is just a technical indicator, this is a documentary about whales.
Readme
In real life, I am a prolific inventor. I have successfully applied for more than 60 international and regional patents in the past 12 years. But in the past two years or so, I have tried to transfer my creativity to the development of trading strategies. Tradingview is the ideal platform for me. I am selecting and contributing some of the hundreds of scripts to publish in Tradingview community. Welcome everyone to interact with me to discuss these interesting pine scripts.
The scripts posted are categorized into 5 levels according to my efforts or manhours put into these works.
Level 1 : interesting script snippets or distinctive improvement from classic indicators or strategy. Level 1 scripts can usually appear in more complex indicators as a function module or element.
Level 2 : composite indicator/strategy. By selecting or combining several independent or dependent functions or sub indicators in proper way, the composite script exhibits a resonance phenomenon which can filter out noise or fake trading signal to enhance trading confidence level.
Level 3 : comprehensive indicator/strategy. They are simple trading systems based on my strategies. They are commonly containing several or all of entry signal, close signal, stop loss, take profit, re-entry, risk management, and position sizing techniques. Even some interesting fundamental and mass psychological aspects are incorporated.
Level 4 : script snippets or functions that do not disclose source code. Interesting element that can reveal market laws and work as raw material for indicators and strategies. If you find Level 1~2 scripts are helpful, Level 4 is a private version that took me far more efforts to develop.
Level 5 : indicator/strategy that do not disclose source code. private version of Level 3 script with my accumulated script processing skills or a large number of custom functions. I had a private function library built in past two years. Level 5 scripts use many of them to achieve private trading strategy.

NEURAL FLOW INDEX — Core Energy • Momentum Stream • Pulse SyncNeural Flow Index (NFI) — Advanced Triple-Layer Reversal Framework
The Neural Flow Index (NFI) is a next-generation market oscillator designed to reveal the hidden synchronization between trend energy, cyclical momentum, and internal pulse dynamics.
It merges three powerful analytical layers into a single, normalized view:
Core Energy Curve (based on RSO logic) — captures structural trend bias and volatility expansion.
Momentum Stream (WaveTrend algorithm) — visualizes cyclical motion of price waves.
Pulse Sync (Stochastic RSI adaptation) — measures short-term momentum rhythm and overextension.
Each layer feeds into a unified flow model that adapts to both trend-following and reversal conditions. The goal is not to chase every fluctuation, but to sense where momentum, direction, and volatility converge into true inflection points.
Conceptual Mechanics
The oscillator translates complex market behavior into an elegant, multi-phase signal system:
Core Energy Curve (RSO foundation):
A smoothed dynamic field representing the overall strength and direction of market pressure.
Green energy indicates expansion (bullish dominance); red energy reflects contraction (bearish decay).
Momentum Stream (WaveTrend):
The teal line functions like an electro-wave, oscillating through phases of expansion and exhaustion.
It provides the heartbeat of the market — smooth, rhythmic, and beautifully cyclic.
Pulse Sync (Stochastic RSI):
The purple line acts as the market’s nervous pulse, reacting to micro-momentum changes before the larger trend adjusts.
It identifies micro-tops and micro-bottoms that precede major trend shifts.
When these three forces align, they create high-probability reversal zones known as Neural Nodes — regions where energy, momentum, and rhythm converge.
Trading Logic
Potential Entry Zones:
When the purple Pulse Sync line crosses the green Momentum Stream near the lower or upper bounds of the oscillator, a potential turning point forms.
Yet, these crossovers are only validated when the Core Energy histogram (RSO) simultaneously supports the same direction — confirming that energy and rhythm are synchronized.
Histogram Confirmation:
The histogram is the “voice” of the oscillator.
Rising green volume within the histogram during a Pulse-Momentum crossover suggests a legitimate upward reversal.
Conversely, expanding red energy during an upper-band cross indicates momentum exhaustion and an early short-side opportunity.
Neutral Zones:
When all three layers flatten near the zero line, the market enters an equilibrium phase — no clear trend dominance, ideal for patience and re-entry planning.
| Layer | Representation | Color | Function |
| --------------------- | ------------------- | ----------------- | ------------------------------ |
| **Core Energy Curve** | Area / Histogram | Lime-Red gradient | Trend bias & volatility energy |
| **Momentum Stream** | WaveTrend line | Teal | Cyclical flow of price |
| **Pulse Sync** | Stochastic RSI line | Purple | Short-term momentum rhythm |
Interpretation Summary
Converging Waves: Trend, momentum, and pulse move together → strong continuation.
Diverging Waves: Pulse or Momentum decouple from Core Energy → early reversal warnings.
Histogram Expansion: Confirms direction and strength of the new wave.
Crossovers at Extremes: Potential entries, especially when confirmed by energy alignment.
🪶 Philosophy Behind NFI
The Neural Flow Index is not just a technical indicator — it’s a behavioral visualization system.
Instead of focusing on lagging confirmations, it captures the neural pattern of price motion:
how liquidity flows, contracts, and expands through time.
It bridges the gap between pure mathematics and market intuition — giving traders a cinematic, harmonic view of energy transition inside price structure.

Kelly Wave Position Matrix 20251024 V1 ZENYOUNGA simple table is designed for use when opening a position. It applies the Kelly formula to calculate a more scientific position size based on win rate and risk–reward ratio. At the same time, it displays 1.65× ATR stop-loss levels for both long and short positions to serve as a reference for comparing with existing stop-loss placements.
Additionally, the table back-calculates the corresponding position size based on a 2% total capital loss limit, using the actual loss ratio. It also shows the current wave trend status as a pre-filtering condition.
Overall, this table integrates the core elements of trading — trend (wave confirmation), win rate, risk–reward ratio, and position sizing — making it an effective checklist before entering a trade. Its purpose is to help achieve a probabilistic edge and ensure positive expected value in trading decisions.

ZS Master Vision Pro - Advanced Multi-Timeframe Trading SystemZS MASTER VISION PRO - PROFESSIONAL TRADING SUITE
Created by Zakaria Safri
A comprehensive, all-in-one trading system combining multiple proven technical analysis methods into a single, powerful indicator. Designed for traders who demand precision, clarity, and actionable signals across all timeframes.
KEY FEATURES
CORE TREND ALGORITHM
Adaptive ATR-based trend detection with dynamic support and resistance zones. Features Type A and Type B signal modes for different trading styles, strong signal detection in key reversal zones, and optional EMA source smoothing for noise reduction.
MULTI-LAYER EMA CLOUD SYSTEM
Five customizable EMA cloud layers for multi-timeframe analysis with theme-adaptive color coding across five professional themes. Optional line display for detailed MA tracking with configurable periods from scalping to position trading.
WAVE TREND OSCILLATOR
Advanced momentum oscillator with channel-based calculations featuring smart reversal detection at extreme overbought and oversold levels. Includes directional strength confirmation and customizable sensitivity with adjustable reaction periods.
DIVERGENCE SCANNER
Detects four types of divergence automatically:
- Regular Bullish: Price making lower lows while oscillator making higher lows
- Regular Bearish: Price making higher highs while oscillator making lower highs
- Hidden Bullish: Trend continuation signals in uptrends
- Hidden Bearish: Trend continuation signals in downtrends
Automatic fractal-based detection with clear visual labels on chart.
MARKET BIAS INDICATOR
Heikin Ashi-based trend strength analysis with real-time bias calculation showing Bullish or Bearish combined with Strong or Weak conditions. Smoothed for cleaner signals and perfect for trend confirmation.
MOMENTUM SYSTEM
Proprietary momentum calculation using adaptive smoothing with growing and falling state detection. Normalized values for consistent interpretation and responsive to rapid market changes.
DYNAMIC SUPPORT AND RESISTANCE
Automatic pivot-based support and resistance level detection with adjustable left and right bar lookback. Non-repainting levels with visual clarity through color-coded lines.
LIVE INFORMATION DASHBOARD
Real-time market analysis panel displaying current trend direction, market bias based on Heikin Ashi, Wave Trend status and value, and momentum trend with state. Customizable display options with theme-adaptive colors.
VISUAL CUSTOMIZATION
FIVE PROFESSIONAL COLOR THEMES:
Pro - Modern green and red color scheme (default)
Classic - Traditional teal and red combination
Cyberpunk - Neon cyan and magenta contrast
Ocean - Blue and orange contrast
Sunset - Gold and red warmth
SIGNAL STYLES:
Labels with emoji indicators (BUY with rocket, SELL with bear, STRONG with lightning)
Arrows for clean minimal appearance
Triangles for classic approach
DISPLAY OPTIONS:
Color-coded candles following trend direction
Trend background highlighting for instant trend recognition
Optional EMA line display for detailed analysis
Adjustable transparency levels for personal preference
SMART ALERTS
Pre-configured alert conditions for all major signals:
Buy signals for standard entry opportunities
Sell signals for standard exit or short opportunities
Strong buy signals for high-confidence long entries
Strong sell signals for high-confidence short entries
Bullish divergence detection alerts
Bearish divergence detection alerts
Alert messages automatically include ticker symbol, current price, and specific signal type for quick decision making.
HOW TO USE
FOR TREND TRADERS:
Enable EMA Clouds with focus on Cloud 5 featuring 50 and 200 period moving averages. Wait for trend background color change to confirm direction. Enter on STRONG signals aligned with higher timeframe trend direction. Use support and resistance levels for strategic exits.
FOR SWING TRADERS:
Enable Wave Trend Oscillator information display. Look for oversold and overbought reversal setups. Confirm potential reversals with divergence scanner. Enter on smart reversal signals with proper risk management.
FOR SCALPERS:
Use Type B signal mode for more frequent trading signals. Enable Cloud 1 with 5 and 13 periods for quick trend confirmation. Focus on momentum growing and falling states for entry timing. Take quick entries on regular buy and sell signals.
FOR POSITION TRADERS:
Use Type A mode with higher ATR multiplier set to 3.0 or above. Enable only Cloud 5 with 50 and 200 periods for major trend confirmation. Only take STRONG signals for highest probability setups. Hold positions through minor pullbacks and noise.
RECOMMENDED SETTINGS
STOCKS ON DAILY TIMEFRAME:
Trend Period: 180
ATR Period: 155
ATR Multiplier: 2.1
Signal Mode: Type A
FOREX ON HOURLY AND 4-HOUR TIMEFRAMES:
Trend Period: 150
ATR Period: 120
ATR Multiplier: 2.5
Signal Mode: Type A
CRYPTOCURRENCY ON 15-MINUTE AND 1-HOUR TIMEFRAMES:
Trend Period: 100
ATR Period: 80
ATR Multiplier: 3.0
Signal Mode: Type B
SCALPING ON 1-MINUTE AND 5-MINUTE TIMEFRAMES:
Trend Period: 50
ATR Period: 40
ATR Multiplier: 2.0
Signal Mode: Type B
WHAT IS INCLUDED
Trend Analysis using ATR-based adaptive algorithm
Five EMA Cloud Layers for multi-timeframe confluence
Wave Trend Oscillator for momentum and reversal detection
Divergence Scanner detecting four types of divergence
Market Bias using Heikin Ashi-based trend strength
Momentum System with advanced momentum tracking
Support and Resistance Levels with automatic pivot detection
Live Dashboard showing real-time market analysis
Smart Alerts featuring six pre-configured alert types
Five Color Themes offering professional visual options
TECHNICAL DETAILS
CALCULATION METHODS:
Average True Range (ATR) for volatility adaptation
Exponential Moving Average (EMA) and Simple Moving Average (SMA) for trend smoothing
Wave Trend channel oscillator for momentum analysis
Fractal-based divergence detection algorithm
Heikin Ashi transformation for bias calculation
Logarithmic momentum calculation for precision
PERFORMANCE CHARACTERISTICS:
Optimized for maximum speed and efficiency
No repainting signals ensuring reliability
Works on all timeframes from 1 minute to monthly
Compatible with all instruments including stocks, forex, crypto, and futures
RISK DISCLAIMER
This indicator is a technical analysis tool and should not be used as the sole basis for trading decisions. Always use proper risk management and never risk more than you can afford to lose. Combine with other analysis methods and practice on demo accounts first. Past performance does not guarantee future results. Trading carries substantial risk and is not suitable for all investors.
SUPPORT AND UPDATES
Regular updates and continuous improvements
Based on proven technical analysis principles
Developed following Pine Coders best practices and standards
Clean, well-documented, and optimized code structure
WHY CHOOSE ZS MASTER VISION PRO
All-in-one solution eliminating the need for multiple indicators
Highly customizable to adapt to your specific trading style
Professional grade analysis with institutional-quality standards
Clean interface that is not cluttered or confusing
Works everywhere across all markets and all timeframes
Smart signals filtered for quality over quantity
Beautiful design featuring five professional color themes
Active development with regular improvements and updates
Transform your trading with ZS Master Vision Pro today.
Version 2.0 | Created by Zakaria Safri | Pine Script Version 5

Continuation Gauge - ES 3m (v1.1)Continuation Gauge - ES 3m (v1.1)
wave trend analysis between bull and bear imbalance trends

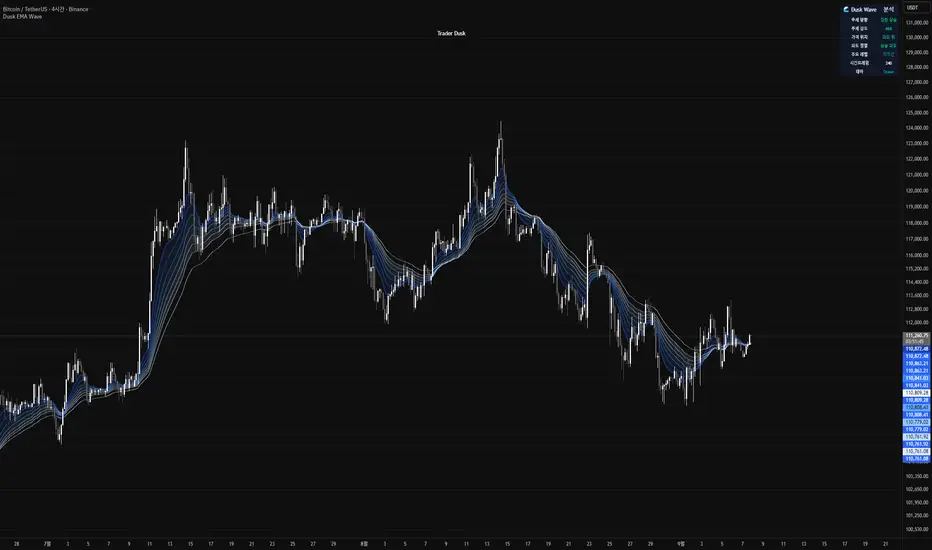
Dusk Wave🌊 Dusk Wave (시각적 분석 도구)
개요
기반 기술: 8단계 추세 파도 시각화
시간대: 모든 시간대 호환
신호: 신호 없음 (분석 전용)
용도: 추세 방향 및 강도 분석
Wave 테이블 설명
DUSK WAVE | TREND ANALYSIS
├─ Wave Alignment: 8개 파도 정렬 상태
├─ Trend Strength: 추세 강도 (Strong/Medium/Weak)
├─ Wave Direction: 파도 전체 방향 (Up/Down/Sideways)
├─ Fast Waves: 단기 파도 상태 (1-4번)
├─ Slow Waves: 장기 파도 상태 (5-8번)
├─ Convergence: 파도 수렴/발산 상태
└─ Trend Quality: 추세 품질 등급 (A/B/C/D)
Wave 해석 가이드
파란색 그라데이션: 8개 EMA 파도 표시
정렬 상태: 모든 파도가 같은 방향 = 강한 추세
파도 간격: 좁을수록 강한 추세, 넓을수록 약한 추세
색상 변화: 파도별 속도 차이 시각화
🌊 Dusk Wave (Visual Analysis Tool) - English Version
Overview
Core Technology: 8-Stage Trend Wave Visualization
Timeframe: Compatible with all timeframes
Signals: No signals (Analysis only)
Purpose: Trend direction and strength analysis
Wave Table Description
DUSK WAVE | TREND ANALYSIS
├─ Wave Alignment: 8 wave alignment status
├─ Trend Strength: Trend intensity (Strong/Medium/Weak)
├─ Wave Direction: Overall wave direction (Up/Down/Sideways)
├─ Fast Waves: Short-term wave status (Waves 1-4)
├─ Slow Waves: Long-term wave status (Waves 5-8)
├─ Convergence: Wave convergence/divergence state
└─ Trend Quality: Trend quality grade (A/B/C/D)
Wave Interpretation Guide
Blue Gradient: 8 EMA waves display
Alignment Status: All waves same direction = Strong trend
Wave Spacing: Closer = Stronger trend, Wider = Weaker trend
Color Changes: Visualizes speed differences between waves
Mutanabby_AI __ OSC+ST+SQZMOMMutanabby_AI OSC+ST+SQZMOM: Multi-Component Trading Analysis Tool
Overview
The Mutanabby_AI OSC+ST+SQZMOM indicator combines three proven technical analysis components into a unified trading system, providing comprehensive market analysis through integrated oscillator signals, trend identification, and volatility assessment.
Core Components
Wave Trend Oscillator (OSC): Identifies overbought and oversold market conditions using exponential moving average calculations. Key threshold levels include overbought zones at 60 and 53, with oversold areas marked at -60 and -53. Crossover signals between the two oscillator lines generate entry opportunities, displayed as colored circles on the chart for easy identification.
Supertrend Indicator (ST): Determines overall market direction using Average True Range calculations with a 2.5 factor and 10-period ATR configuration. Green lines indicate confirmed uptrends while red lines signal downtrend conditions. The indicator automatically adapts to market volatility changes, providing reliable trend identification across different market environments.
Squeeze Momentum (SQZMOM): Compares Bollinger Bands with Keltner Channels to identify consolidation periods and potential breakout scenarios. Black squares indicate squeeze conditions representing low volatility periods, green triangles signal confirmed upward breakouts, and red triangles mark downward breakout confirmations.
Signal Generation Logic
Long Entry Conditions:
Green triangles from Squeeze Momentum component
Supertrend line transitioning to green
Bullish crossovers in Wave Trend Oscillator from oversold territory
Short Entry Conditions:
Red triangles from Squeeze Momentum component
Supertrend line transitioning to red
Bearish crossovers in Wave Trend Oscillator from overbought territory
Automated Risk Management
The indicator incorporates comprehensive risk management through ATR-based calculations. Stop losses are automatically positioned at 3x ATR distance from entry points, while three progressive take profit targets are established at 1x, 2x, and 3x ATR multiples respectively. All risk management levels are clearly displayed on the chart using colored lines and informative labels.
When trend direction changes, the system automatically clears previous risk levels and generates new calculations, ensuring all risk parameters remain current and relevant to existing market conditions.
Alert and Notification System
Comprehensive alert framework includes trend change notifications with complete trade setup details, squeeze release alerts for breakout opportunity identification, and trend weakness warnings for active position management. Alert messages contain specific trading pair information, timeframe specifications, and all relevant entry and exit level data.
Implementation Guidelines
Timeframe Selection: Higher timeframes including 4-hour and daily charts provide the most reliable signals for position trading strategies. One-hour charts demonstrate good performance for day trading applications, while 15-30 minute timeframes enable scalping approaches with enhanced risk management requirements.
Risk Management Integration: Limit individual trade risk to 1-2% of total capital using the automatically calculated stop loss levels for precise position sizing. Implement systematic profit-taking at each target level while adjusting stop loss positions to protect accumulated gains.
Market Volatility Adaptation: The indicator's ATR-based calculations automatically adjust to changing market volatility conditions. During high volatility periods, risk management levels appropriately widen, while low volatility conditions result in tighter risk parameters.
Optimization Techniques
Combine indicator signals with fundamental support and resistance level analysis for enhanced signal validation. Monitor volume patterns to confirm breakout strength, particularly when Squeeze Momentum signals develop. Maintain awareness of scheduled economic events that may influence market behavior independent of technical indicator signals.
The multi-component design provides internal signal confirmation through multiple alignment requirements, significantly reducing false signal occurrence while maintaining reasonable trade frequency for active trading strategies.
Technical Specifications
The Wave Trend Oscillator utilizes customizable channel length (default 10) and average length (default 21) parameters for optimal market sensitivity. Supertrend calculations employ ATR period of 10 with factor multiplier of 2.5 for balanced signal quality. Squeeze Momentum analysis uses Bollinger Band length of 20 periods with 2.0 multiplication factor, combined with Keltner Channel length of 20 periods and 1.5 multiplication factor.
Conclusion
The Mutanabby_AI OSC+ST+SQZMOM indicator provides a systematic approach to technical market analysis through the integration of proven oscillator, trend, and momentum components. Success requires thorough understanding of each element's functionality and disciplined implementation of proper risk management principles.
Practice with demo trading accounts before live implementation to develop familiarity with signal interpretation and trade management procedures. The indicator's systematic approach effectively reduces emotional decision-making while providing clear, objective guidelines for trade entry, management, and exit strategies across various market conditions.

KTUtilsLibrary "KTUtils"
Utility functions for technical analysis indicators, trend detection, and volatility confirmation.
MGz(close, length)
MGz
@description Moving average smoother used for signal processing
Parameters:
close (float) : float Price input (typically close)
length (int) : int Length of smoothing period
Returns: float Smoothed value
atrConf(length)
atrConf
@description Calculates Average True Range (ATR) for volatility confirmation
Parameters:
length (simple int) : int Length for ATR calculation
Returns: float ATR value
f(input)
f
@description Simple Moving Average with fixed length
Parameters:
input (float) : float Input value
Returns: float Smoothed average
bcwSMA(s, l, m)
bcwSMA
@description Custom smoothing function with weight multiplier
Parameters:
s (float) : float Signal value
l (int) : int Length of smoothing
m (int) : int Weighting multiplier
Returns: float Smoothed output
MGxx(close, length)
MGxx
@description Custom Weighted Moving Average (WMA) variant
Parameters:
close (float) : float Price input
length (int) : int Period length
Returns: float MGxx smoothed output
_PerChange(lengthTime)
_PerChange
@description Measures percentage price change over a period and range deviation
Parameters:
lengthTime (int) : int Period for change measurement
Returns: tuple Measured change, high deviation, low deviation
dirmov(len)
dirmov
@description Calculates directional movement components
Parameters:
len (simple int) : int Lookback period
Returns: tuple Plus and Minus DI values
adx(dilen, adxlen)
adx
@description Calculates Average Directional Index (ADX)
Parameters:
dilen (simple int) : int Length for DI calculation
adxlen (simple int) : int Length for ADX smoothing
Returns: float ADX value
trChopAnalysis()
trChopAnalysis
@description Identifies chop and trend phases based on True Range Bollinger Bands
Returns: tuple TR SMA, chop state, trending state
wtiAnalysis(haclose, close, filterValue)
wtiAnalysis
@description Wave Trend Indicator (WTI) with signal crossover logic
Parameters:
haclose (float) : float Heikin-Ashi close
close (float) : float Standard close
filterValue (simple int) : int Smoothing length
Returns: tuple WTI lines and direction states
basicTrend(hahigh, halow, close, open, filterValue)
basicTrend
@description Determines trend direction based on HA high/low and close
Parameters:
hahigh (float) : float Heikin-Ashi high
halow (float) : float Heikin-Ashi low
close (float) : float Standard close
open (float) : float Standard open
filterValue (simple int) : int Smoothing period
Returns: tuple Uptrend, downtrend flags
metrics(close, filterValue)
metrics
@description Common market metrics
Parameters:
close (float) : float Price input
filterValue (int) : int RSI smoothing length
Returns: tuple VWMA, SMA10, RSI, smoothed RSI
piff(close, trend_change)
piff
@description Price-Informed Forward Forecasting (PIFF) model for trend strength
Parameters:
close (float) : float Price input
trend_change (float) : float Change in trend
Returns: tuple Percent change, flags for trend direction
getMACD()
getMACD
@description Returns MACD, signal line, and histogram
Returns: tuple MACD line, Signal line, Histogram
getStoch()
getStoch
@description Returns K and D lines of Stochastic Oscillator
Returns: tuple K and D lines
getKDJ()
getKDJ
@description KDJ momentum oscillator
Returns: tuple K, D, J, Average
getBBRatio()
getBBRatio
@description Bollinger Band Ratio (BBR) and signal flags
Returns: tuple Basis, Upper, Lower, BBR, BBR Up, BBR Down
getSupertrend()
getSupertrend
@description Supertrend values and direction flags
Returns: tuple Supertrend, Direction, Up, Down

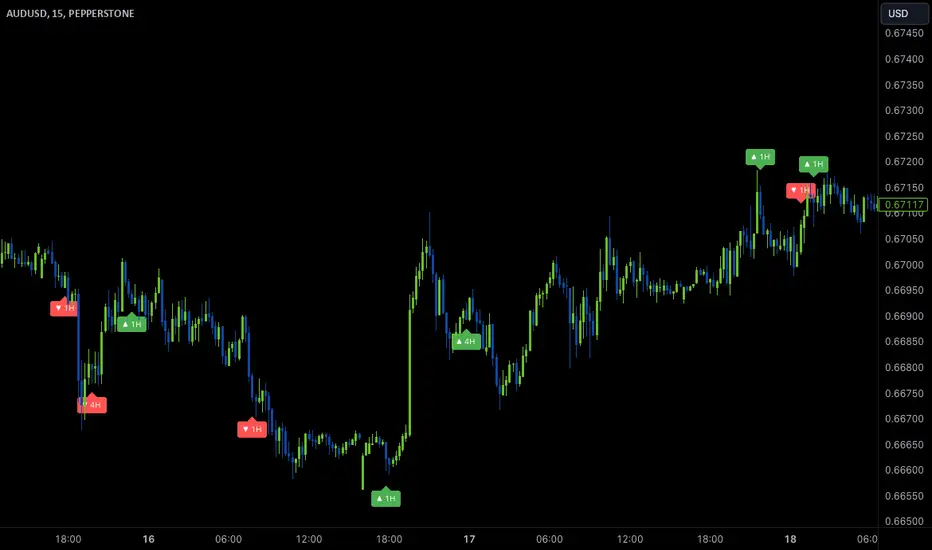
Wave Anchor IndicatorThe Wave Anchor Indicator is designed to mark the crossing of overbought and oversold levels of higher time frame momentum waves, based on the VuManChu Cipher B+Divergences Wave Trend Indicator. This tool is inspired by the TP Mint trading strategy, which relies heavily on the momentum waves of Market Cipher B or VuManChu Cipher B for identifying optimal entry and exit points.
Key Concept: Anchored Waves
In the TP Mint strategy, momentum waves in overbought (above 60) or oversold (below -60) conditions on higher time frames are considered "anchored." These anchored waves provide strong signals for entries and take-profit points when viewed on lower time frames. The Wave Anchor Indicator focuses on these anchor conditions to help traders make informed decisions by seeing higher time frame anchor states directly on the entry time frame chart.
How It Works
Labeling Signals:
- On lower time frames, such as the 15-minute chart, the indicator shows labels when higher
time frame momentum waves (1-hour and 4-hour) cross the overbought or oversold levels.
- Labels above price indicate overbought conditions, with green labels when the wave crosses
upward and red labels when crossing downward.
- Labels below price signal oversold conditions, with red for a downward cross and green for an
upward cross.
- Each label displays the time frame of the crossing momentum wave, providing context for
traders at a glance.
Time Frame Pairings:
- On the 15-minute time frame, the indicator tracks anchor conditions from the 1-hour and 4-
hour time frames.
- On the 1-hour chart, it monitors 4-hour and daily time frame anchor conditions.
Customization and Alerts
Flexible Display Options : Users can choose to display none, one, or both of the grouped higher time frame labels, depending on their strategy and preferences.
Alerts : The indicator also allows for custom alerts when a label appears, helping traders stay on top of key market movements without constantly monitoring the chart.
Use Cases
This indicator is ideal for traders who use momentum-based strategies across multiple time frames. It simplifies the process of identifying key entry and exit points by focusing on the anchor conditions from higher time frames, making it easier to execute the TP Mint strategy or similar methods.
Thank you to VuManChu and LazyBear for mamking the momentum wave code open source and allowing it’s use in this indicator.
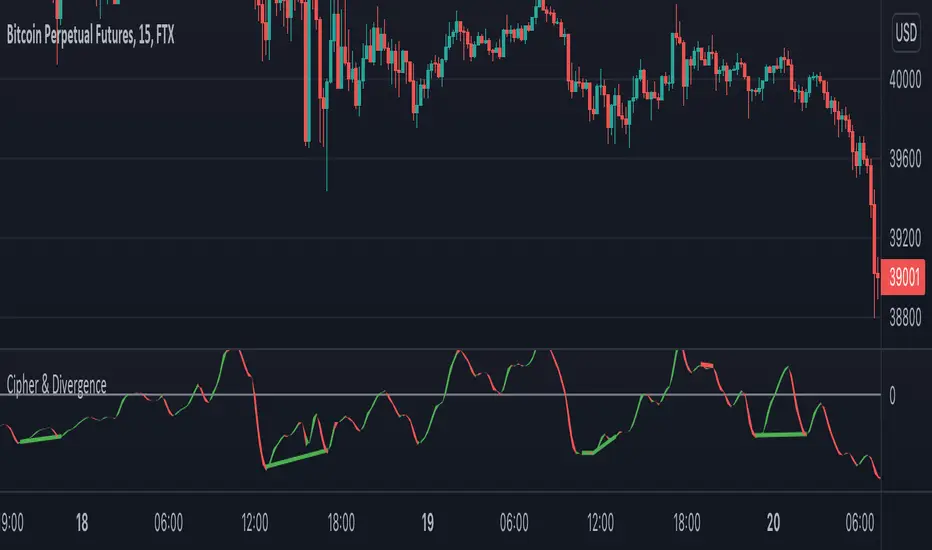
Cipher & DivergenceFor a long time I've been using complicated script with too much informations in it.
In this one I try to have just the bare minimum information to be able to analyse and find a potential reversal zone.
It is inspired from different wave trend / cipher script but has been tuned after months of backtest.
Extending the usage of the wave trend oscillator, which can be used with overbuy & oversell zone it might be better to wait for a confirmation of the movement. This confirmation can be identified by a pull back of the wave trend & price.
We can even confort ourself by waiting for reversal indicators.
Reversal may occurs after a divergence, wait for it, a cross of zero line followed by a PB to find your entry.
You can setup alert on bear / bull divergence but also when the wave trend cross the zero line to never miss a potential trade.
Huge thanks to LazyBear for his wave trend
And thanks vumanchu for his huge cipher script which was very useful for divergence finder
40 crypto screener [LUPOWN]// ENGLISH
This indicator shows two tables, with 10 assets each, they can be currencies, stocks or cryptos, the columns can be changed to the information you want to see, among the options are price or change (change in percentage of the candle in the temporality where you are seeing it), TL are buy or sell signals according to the Latin trading strategy (Squeeze momentum combined with ADX) buy if the momentum changes to range or rise and the ADX has a negative slope, sell if the momentum changes to range or fall and The ADX has a negative slope, the signals are not 100% effective, you must support it with price action and market speculation, directionality in the momentum, slope of the ADX, if there is divergence in the momoentum squeeze, lux something and cipher use an indicator of Lazy bear, lux something signals when two wave trends cross and the cipher signals when the wave trend crosses above or below the 0 point.
You can choose between seeing one or two tables, this so that it can be seen on small screens, there is also the option to hide the tables and show the label, which is also an alternative to see it on small screens
i got the main idea from @QuantNomad
//SPANISH
Este indicador muestra dos tablas, con 10 activos cada una, pueden ser divisas, acciones o cryptos, las columnas se pueden cambiar a la información que quieras ver, entre las opciones están precio o cambio (cambio en porcentaje de la vela en la temporalidad donde lo estes viendo), TL son señales de compra o venta según estrategia de trading latino (Squeeze momentum combinado con ADX) compra si el momentum cambia a rango o subida y el ADX tiene pendiente negativa, venta si el momentum cambia a rango o caída y el ADX tiene pendiente negativa, las señales no son 100% efectivas debes apoyarla con la acción del precio y especulación del mercado, direccionalidad en el momentum, pendiente del ADX, si hay divergencia en el squeeze momoentum, lux algo y cipher utilizan un indicador de Lazy bear, lux algo da señal cuando dos wave trend se cruzan y el cipher da señal cuando el wave trend cruza por encima o debajo del punto 0.
Puedes elegir entre ver una o dos tablas, esto para que se pueda ver en pantallas pequeñas, también esta la opción de ocultar las tablas y mostrar el label, que también es una alternativa para verlo en pantallas pequeñas
La idea principal la tome de @QuantNomad

Realtime 5D Profile [LucF]█ OVERVIEW
This indicator displays a realtime profile that can be configured to visualize five dimensions: volume, price, time, activity and age. For each price level in a bar or timeframe, you can display total or delta volume or ticks. The tick count measures activity on a level. The thickness of each level's line indicates its age, which helps you identify the most recent levels.
█ WARNING
The indicator only works in real time. Contrary to TradingView's line of volume profile indicators , it does not show anything on historical bars or closed markets, and it cannot display volume information if none exists for the data feed the chart is using. A realtime indicator such as this one only displays information accumulated while it is running on a chart. The information it calculates cannot be saved on charts, nor can it be recalculated from historical bars. If you refresh the chart, or the script must re-execute for some reason, as when you change inputs, the accumulated information will be lost.
Because "Realtime 5D Profile" requires time to accumulate information on the chart, it will be most useful to traders working on small timeframes who trade only one instrument and do not frequently change their chart's symbol or timeframe. Traders working on higher timeframes or constantly changing charts will be better served by TradingView's volume profiles. Before using this indicator, please see the "Limitations" section further down for other important information.
█ HOW TO USE IT
Load the indicator on an active chart (see here if you don't know how).
The default configuration displays:
• A double-sided volume profile showing at what price levels activity has occurred.
• The left side shows "down" volume, the right side shows "up" volume.
• The value corresponding to each level is displayed.
• The width of lines reflects their relative value.
• The thickness of lines reflects their age. Four thicknesses are used, with the thicker lines being the most recent.
• The total value of down/up values for the profile appears at the top.
To understand how to use profiles in your trading, please research the subject. Searches on "volume profile" or "market profile" will yield many useful results. I provide you with tools — I do not teach trading. To understand more about this indicator, read on. If you choose not to do so, please don't ask me to answer questions that are already answered here, nor to make videos; I don't.
█ CONCEPTS
Delta calculations
Volume is slotted in up or down slots depending on whether the price of each new chart update is higher or lower than the previous update's price. When price does not move between chart updates, the last known direction is used. In a perfect world, Pine scripts would have access to bid and ask levels, as this would allow us to know for sure if market orders are being filled on upticks (at the ask) or downticks (at the bid). Comparing the price of successive chart updates provides the most precise way to calculate volume delta on TradingView, but it is still a compromise. Order books are in constant movement; in some cases, order cancellations can cause sudden movements of both the bid and ask levels such that the next chart update can occur on an uptick at a lower price than the previous one (or vice versa). While this update's volume should be slotted in the up slot because a buy market order was filled, it will erroneously be slotted in the down slot because the price of the chart's update is lower than that of the previous one. Luckily, these conditions are relatively rare, so they should not adversely affect calculations.
Levels
A profile is a tool that displays information organized by price levels. You can select the maximum quantity of levels this indicator displays by using the script's "Levels" input. If the profile's height is small enough for level increments to be less than the symbol's tick size, a smaller quantity of levels is used until the profile's height grows sufficiently to allow your specified quantity of levels to be displayed. The exact position of levels is not tethered to the symbol's tick increments. Activity for one level is that which happens on either side of the level, halfway between its higher or lower levels. The lowest/highest levels in the profile thus appear higher/lower than the profile's low/high limits, which are determined by the lowest/highest points reached by price during the profile's life.
Level Values and Length
The profile's vertical structure is dynamic. As the profile's height changes with the price range, it is rebalanced and the price points of its levels may be recalculated. When this happens, past updates will be redistributed among the new profile's levels, and the level values may thus change. The new levels where updates are slotted will of course always be near past ones, but keep this fluidity in mind when watching level values evolve.
The profile's horizontal structure is also dynamic. The maximum length of level lines is controlled by the "Maximum line length" input value. This maximum length is always used for the largest level value in the profile, and the length of other levels is determined by their value relative to that maximum.
Updates vs Ticks
Strictly speaking, a tick is the record of a transaction between two parties. On TradingView, these are detected on seconds charts. On other charts, ticks are aggregated to form a chart update . I use the broader "update" term when it names both events. Note that, confusingly, tick is also used to name an instrument's minimal price increment.
Volume Quality
If you use volume, it's important to understand its nature and quality, as it varies with sectors and instruments. My Volume X-ray indicator is one way you can appraise the quality of an instrument's intraday volume.
█ FEATURES
Double-Sided Profiles
When you choose one of the first two configuration selections in the "Configuration" field's dropdown menu, you are asking the indicator to display a double-sided profile, i.e., where the down values appear on the left and the up ones on the right. In this mode, the formatting options in the top section of inputs apply to both sides of the profile.
Single-Sided Profiles
The six other selections down the "Configuration" field's dropdown menu select single-sided profiles, where one side aggregates the up/down values for either volume or ticks. In this mode, the formatting options in the top section of inputs apply to the left profile. The ones in the following "Right format" section apply to the right profile.
Calculation Mode
The "Calculation" input field allows the selection of one of two modes which applies to single-sided profiles only. Values can represent the simple total of volume or ticks at each level, or their delta. The mode has no effect when a double-sided profile is used because then, the total is represented by the sum of the left and right sides. Note that when totals are selected, all levels appear in the up color.
Age
The age of each level is always displayed as one of four line thicknesses. Thicker lines are used for the youngest levels. The age of levels is determined by averaging the times of the updates composing that level. When viewing double-sided profiles, the age of each side is calculated independently, which entails you can have a down level on the left side of the profile appear thinner than its corresponding up side level line on the right side because the updates composing the up side are more recent. When calculating the age of single-sided profiles, the age of the up/down values aggregated to calculate the side are averaged. Since they may be different, the averaged level ages will not be as responsive as when using a double-sided profile configuration, where the age of levels on each side is calculated independently and follows price action more closely. Moreover, when displaying two single-sided profiles (volume on one side and ticks on the other), the age of both sides will match because they are calculated from the same realtime updates.
Profile Resets
The profile can reset on timeframes or trend changes. The usual timeframe selections are available, including the chart's, in which case the profile will reset on each new chart bar. One of two trend detection logics can be used: Supertrend or the one used by LazyBear in his Weis Wave indicator . Settings for the trend logics are in the bottommost section of the inputs, where you can also control the display of trend changes and states. Note that the "Timeframe" field's setting also applies to the trend detection mechanism. Whatever the timeframe used for trend detection, its logic will not repaint.
Format
Formatting a profile for charts is often a challenge for traders, and this one is no exception. Varying zoom factors on your chart and the frequency of profile resets will require different profile formats. You can achieve a reasonable variety of effects by playing with the following input fields:
• "Resets on" controls how frequently new profiles are drawn. Spacing out profiles between bars can help make them more usable.
• "Levels" determines the maximum quantity of levels displayed.
• "Offset" allows you to shift the profile horizontally.
• "Profile size" affects the global size of the profile.
• Another "Size" field provides control over the size of the totals displayed above the profile.
• "Maximum line length" controls how far away from the center of the bar the lines will stretch left and right.
Colors
The color and brightness of levels and totals always allows you to determine the winning side between up and down values. On double-sided profiles, each side is always of one color, since the left side is down values and the right side, up values. However, the losing side is colored with half its brightness, so the emphasis is put on the winning side. When there is no winner, the toned-down version of each color is used for both sides. Single-sided profiles use the up and down colors in full brightness on the same side. Which one is used reflects the winning side.
Candles
The indicator can color candle bodies and borders independently. If you choose to do so, you may want to disable the chart's bars by using the eye icon near the symbol's name.
Tooltips
A tooltip showing the value of each level is available. If they do not appear when hovering over levels, select the indicator by clicking on its chart name. This should get the tooltips working.
Data Window
As usual, I provide key values in the Data Window, so you can track them. If you compare total realtime volumes for the profile and the built-in "Volume" indicator, you may see variations at some points. They are due to the different mechanisms running each program. In my experience, the values from the built-in don't always update as often as those of the profile, but they eventually catch up.
█ LIMITATIONS
• The levels do not appear exactly at the position they are calculated. They are positioned slightly lower than their actual price levels.
• Drawing a 20-level double-sided profile with totals requires 42 labels. The script will only display the last 500 labels,
so the number of levels you choose affects how many past profiles will remain visible.
• The script is quite taxing, which will sometimes make the chart's tab less responsive.
• When you first load the indicator on a chart, it will begin calculating from that moment; it will not take into account prior chart activity.
• If you let the script run long enough when using profile reset criteria that make profiles last for a long time, the script will eventually run out of memory,
as it will be tracking unmanageable amounts of chart updates. I don't know the exact quantity of updates that will cause this,
but the script can handle upwards of 60K updates per profile, which should last 1D except on the most active markets. You can follow the number of updates in the Data Window.
• The indicator's nature makes it more useful at very small timeframes, typically in the sub 15min realm.
• The Weis Wave trend detection used here has nothing to do with how David Weis detects trend changes.
LazyBear's version was a port of a port, so we are a few generations removed from the Weis technique, which uses reversals by a price unit.
I believe the version used here is useful nonetheless because it complements Supertrend rather well.
█ NOTES
The aggregated view that volume and tick profiles calculate for traders is a good example of one of the most useful things software can do for traders: look at things from a methodical, mathematical perspective, and present results in a meaningful way. Profiles are powerful because, if the volume data they use is of good enough quality, they tell us what levels are important for traders, regardless of the nature or rationality of the methods traders have used to determine those levels. Profiles don't care whether traders use the news, fundamentals, Fib numbers, pivots, or the phases of the moon to find "their" levels. They don't attempt to forecast or explain markets. They show us real stuff containing zero uncertainty, i.e., what HAS happened. I like this.
The indicator's "VPAA" chart name represents four of the five dimensions the indicator displays: volume, price, activity and age. The time dimension is implied by the fact it's a profile — and I couldn't find a proper place for a "T" in there )
I have not included alerts in the script. I may do so in the future.
For the moment, I have no plans to write a profile indicator that works on historical bars. TradingView's volume profiles already do that, and they run much faster than Pine versions could, so I don't see the point in spending efforts on a poor ersatz.
For Pine Coders
• The script uses labels that draw varying quantities of characters to break the limitation constraining other Pine plots/lines to bar boundaries.
• The code's structure was optimized for performance. When it was feasible, global arrays, "input" and other variables were used from functions,
sacrificing function readability and portability for speed. Code was also repeated in some places, to avoid the overhead of frequent function calls in high-traffic areas.
• I wrote my script using the revised recommendations in the Style Guide from the Pine v5 User Manual.
█ THANKS
• To Duyck for his function that sorts an array while keeping it in synch with another array.
The `sortTwoArrays()` function in my script is derived from the Pine Wizard 's code.
• To the one and only Maestro, RicardoSantos , the creative volcano who worked hard to write a function to produce fixed-width, figure space-padded numeric values.
A change in design made the function unnecessary in this script, but I am grateful to you nonetheless.
• To midtownskr8guy , another Pine Wizard who is also a wizard with colors. I use the colors from his Pine Color Magic and Chart Theme Simulator constantly.
• Finally, thanks to users of my earlier "Delta Volume" scripts. Comments and discussions with them encouraged me to persist in figuring out how to achieve what this indicator does.

Volume Pump WaveThis indicator displays volume as a pump wave. Can be useful for chart analysis and easy detection of anomalies/trends.

MarketVision BWith Special Thanks to Everyone who has gone before me, and who have both allowed me given me permission to bring my version of Market Cipher to the World
Especially LazyBear for his amazing Wave Trend Oscillator and for Aevir, falconCoin, vumanchu, Crypto_Spike and others who have freely brought MarketCipher to the Tradingview Community
Also special mention to RicardoSantos for his Divergence script
MarketVision B - My take on MarketCipher B / Market Cipher B, Ive just put outlines on the Wave Trend to add to the Visual Appeal and Added a Trend Meter and a few more options for the Oscillators
Nice To Look At
Oscillator 1 Choose Between - RSI, MFI and Ultimate Oscillator
For Stochastics Choose Between Standard and RSI Stochastics and for the source you can choose On Balance Volume
Wave Trend
Money Flow
Trend Meter & Signals Bar
Divergences are marked, However they are easy to spot and it is better to train your eyes to spot them before the indicator marks them out
Lots of Alerts and Loads of ways to trade using MarketVision
PS: You can make this look like the original by adjusting the parameters in the menu

Wavetrend strategy with trading session for any time chartHello there
Today I am glad to provide you a strategy based on the wave trend oscillator. If you want to use it as an indicator, just disable long and short to not make any shops.
It works on all time frames.
The way it works its like an RSI .
We have overbought and oversold levels, and together with a channel and length we calculate the wave trend.
And then like in RSI, when we cross those lines we buy or sell depending on which lines we cross.
For risk management, so far its not implemented, but it can be done in many ways.
The only thing I applied is to always close a trade at the end of friday day. At the same time it can be applied the rule to sell when % of equity is lost, or at the end of a trading session like london,neywork and so on.
For any questions or doubts, let me know.
Hope you enjoy it :)

WWV_LB zigzag pivot fix jayyThis is a zigzag version of LazyBear's WWV_LB. In order to plot the WWV_LB as a zigzag, it made sense to me to set the zigzag pivot at the true WWV_LB low or high pivot bars as opposed to the "pivot" bars plotted by the original WWV_LB script. The pivot point identified in the WWV_LB script is actually the point at which a wave reversal is confirmed as opposed to the true script pivot point. Confirmation of a wave reversal can, at times, lag the true pivot by a few bars especially as trendDetectionLength values increase above "1". The WWV_LB script calculates cumulative volume from wave reversal confirmation bar to wave reversal confirmation bar as opposed to the actual/true WWV_LB reversal pivot bar to reversal pivot bar. As such the waves plotted by the original and this pivot fixed scripts not only look slightly different but can also have different cumulative volumes. Confirmation of a wave reversal can lag a few bars behind the true pivot point.
The following critical lines of the original WWV_LB script determine when a wave reverses, both the true pivot and the confirmation point:mov = close>close ? 1 : close
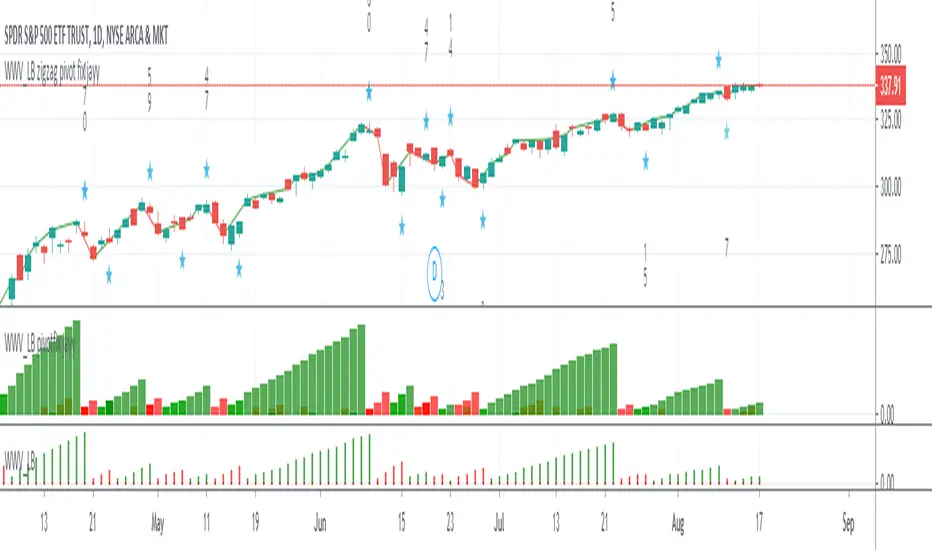
Fractal Resonance BarLazyBear's WaveTrend port has been praised for highlighting trend reversals with precision and punctuality (minimal lag). But strong "3rd Wave" trends can "embed" or saturate any oscillator flashing several premature crosses while stuck overbought/oversold. This happens when the trend stretches over a longer timescale than the oscillator's averaging window or filter time constant. Our solution: monitor many timescales. With Fractal Resonance Bar's rich color codings, strong wavefronts form across timescales and jump out like an approaching line of thunderclouds!
Fractal Resonance Bar color-codes the status of eight underlying stochastic oscillators, with each row averaging over twice the time of the row above.
Fractal Resonance Bar shifts its timescales along with your choice of main chart timescale:
1 minute chart: 1 minute through 128 minute (~2 hour) oscillators.
15 minute chart: 15 minute through 1920 minute (~32 hour) oscillators.
1 hour chart: 1 hour through 128 hour (~2 week) oscillators.
Daily chart: 1 day through 128 day (~4 month) oscillators.
The color map is configured as follows:
Hot Pink: Extreme Overbought (> 100%) rolled over to sell, but oscillators probably embedded with more upside (revert to Dark Green) possible after a pause.
Deep Red: Overbought (> 75%) crossover ripe for selling (validated when red spreads to timescales below).
Brown: Minor (< 75%) crossover sell from which could bounce back green or start a plunge toward gray/black.
Gray/Black: Mature (< -75%) sells turning full black in a plunge before the dawn.
Lime Green: Extreme Oversold (< -100%) and bouncing, though may yet bottom even lower.
Green: Oversold (< -75%) crossover ripe for buy. Green spreading to all timescales below will validate bottom is in.
Dark Green/Teal: Mature buy in overbought (> 75%) range, waiting for sell crossover to Hot Pink for a pause or correction.
White Stripes are Impulsive Trend Warning
Fractal Resonance Bar warns of oscillator embedding by showing white stripes when it detects strong, early surges in the timescale rows below.The white stripes usually accompany Hot Pink warning it's too early to go short, or Lime Green warning it's too early to go long.
Heeding these warnings will probably miss the exact top or bottom, but you're less likely to get overrun in a momentum move.
Usually the market gives us a second opportunity to short very close to the top or buy very close to the bottom after the warning white stripes have subsided.
NOTE: Recently rolled over Futures contracts may not have enough history for all oscillator calculations, in which case no bar colors will appear.
Tweakable Attributes
The default Channel Length, Stochastic Ratio Length and Lag Length work reasonably well on all timescales in our experience. Minor tweaks don't hurt but this may just overfit to a particular chart history.
We don't recommend changing the 75% Overbought and 100% Extreme Overbought default levels as these are ideal numbers relative to the underlying oscillator statistic calculations. But these settings can shift the color transition levels.
Embedded attribute controls the sensitivity/conservativeness of the white strip embedding detectors. Closer to 75 increases the warning sensitivity while closer to 100 decreases the aggressiveness of blocking white stripes.
Embed Separation also affects the white stripe sensitivity.
Row width increases each row's thickness to fill the available screen height you've afforded the bar.

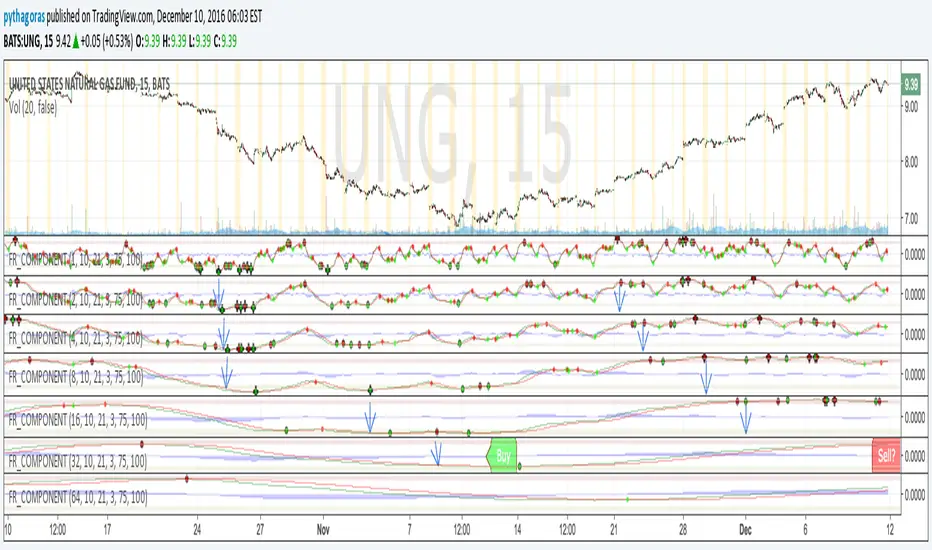
Fractal Resonance ComponentLazyBear's WaveTrend port has been praised for highlighting trend reversals with precision and punctuality (minimal lag). But strong "3rd Wave" trends can "embed" or saturate any oscillator flashing several premature crosses while stuck overbought/oversold. This happens when the trend stretches over a longer timescale than the oscillator's averaging window or filter time constant. Our solution: simultaneously monitor many oscillator timescales. Watch for fresh crossovers in "dominant" timescales alternating most smoothly between the overbought (red shade) and oversold (green shade) range.
Fractal Resonance Component facilitates simultaneous viewing of eight timescales that are power of 2 multiples of the chart timescale. Each timescale shows lead line, lag line, lead-lag difference, and crossover marks. Add 4 to 8 copies to your chart for a good multi-fractal read. Format * the "Timescale Multiplier" attribute of each row to be twice that of the row above for a sequence like 1, 2, 4, 8, 16, 32, 64, 128...
Fractal Resonance Component shifts its timescales along with your choice of main chart timescale:
1 minute chart: 1 minute through 128 minute (~2 hour) oscillators.
1 hour chart: 1 hour through 128 hour (~2 week) oscillators.
Daily chart: 1 day through 128 day (~4 month) oscillators.
Crossovers in different oscillator ranges tend to have different meanings:
Minor (< 75%) crossovers: small green/red dot
usually noise
Overbought/Sold crossovers (shaded 75 to 100%): black outlined dot (o)
reliable reversal indicators (when they appear alone)
Extreme Overbought (> 100%) crossovers: black outlined plus (+).
Can be a major reversal in fast markets, but usually portend the end of Elliot 3rd waves with just a small corrective (4th wave) retrace before the larger impulsive (5-wave) sequence resumes in original direction.
The final 5th-wave terminus should appear later as a lone non-extreme (black outlined circle) crossover on a slower timescale coincident with weaker (non-extreme) dot crosses on this timescale.
Careful examination of historical charts leads to many useful observations such as:
Dominant crossovers punctuating true reversals are usually in the green/red shaded ranges with black outlined dots (o) rather than minor or Extreme (+) ranges.
Due to market's fractal nature, two well-separated timescales like 1 minute and 1 hour can show dominant crosses simultaneously in opposite directions, e.g. the 1 minute showing a very short term high and the 1 hour a medium term low nearby.
Staying Nimble
Watch out for embedding on your supposedly dominant timescale -- a second cross while stuck in the overbought/oversold region suggests a stronger, longer trend than expected. Drop your eyes to a slower timescale below for the real dominant whose crossover will validate main trend reversal.
Embedding can often be predicted even at the first cross mark by checking whether the green lead line of the next slower timescale (one row below) has already hit the Overbought or especially the Extreme Overbought range but isn't close to rolling over. Fractal Resonance Bar (to be published) uses this principle to mark embedded timescales with white stripes, warning of a powerful trend wave on longer timescales you shouldn't fight until the white stripes subside.
Overnight gaps surge all timescales in ways that obscure the dominant timescale, so for shorter than daily charts, these methods work best on Futures contracts that only suffer weekend gaps.
UCS_TTM_Wave A & B & CThis is a replica of TTM Wave A B C.
The ABC Waves are comprised of various moving averages and oscillators (MACD) used to visualize the overall strength and direction of a given market across multiple time frames.
The “A Wave” measures short term relative strength and direction of a market, the “C Wave” measures longer term strength and the “B Wave” plots the same for a medium time period.
Here is the link to the ACTUAL Indicator - members.simpleroptions.com
Instruction -
Load the Indicator three times, Turn Off the Other two Waves. For eg., Wave A - Check / Wave B - Uncheck / Wave C - Uncheck. = This will plot Wave A.

All TimeFrame OscillatorsI have always fighted to understand the market direction because it looks different on different timeframes.
I wanted an indicator where I can see all the different timeframes at once.
This indicator shows already existing oscillators but not only in the current chart's timeframe, but all the most important higer timeframes at once.
I have started with the stoch, then added as many oscillators as I could.
Experimenting with this I have saw that confluence of 4H 1D and 1W Stoch can be very interesting and can highlight higher timeframe take profit areas and sometimes major tops/bottoms.
Also bounces can be interesting when a lower timeframe stoch is bounced or rejected from a higher one.
Oscillators:
Stoch - Stochastic Oscillator
SMI - Stochastic Momentum Index
Rsi - Relative Strength Index
StochRsi - Stochastic RSI
WaveTrend - Vumanchu alias Market Cypher Wave Trend line
CCI - Commodity Channel Index
CCIStoch - Stochastic CCI
Williams Percent Range - Williams %R
Norm. MACD - Normalized Moving Average Convergence Divergence
Norm. MACD Hist - Normalized MACD Histogramm
PVT - Normalized Price Volume Trend
MFI - Money Flow Index
CMF - Chaikin Money Flow
Chande Momentum - Chande Momentum
Volume - Normalized Volume
CandleValue - Vumanchu alias Market Cypher MoneyFlow
BBWP - Bollinger Band Width Percentile
Line Type
Smooth: lines are smoothed, but the actualy not closed values are not shown
Step: Step lines, the actually open timeframes are calculated as they closed at the current values
Plot Oscillator or it's Slope:
its possible to not plot the oscillator but it's slope
Print dots when:
Cross Up/Down oversold/overbougt level - best for most oscillators. for example when Stoch crosses above 20 or below 80
Cross os/ob and the one higher TF is about to cross - when it's crosses beolw 80 and the higher timeframe oscillator is still above ans sloping down
Cross above/below middle line - for example on RSI being above or below 50 can be interesting
Print triangles when:
All Slope Match - all visible timeframe lines are pointing up or down at the same time
All above/belove middle line - all visible lines are above or belove the middle line
All above/belove middle line and slope match - like the previous one and the slope direction is the same
All above/below oversold/overbougt - all lines are above or below os/ ob. this is the default. it can be a very important confluence
Lower TF in order - 5, 15, 30, 60 minute timeframes are in order.
Higher TF in order - 4H 1D 1W in order (like 4H above 1D abd 1D above 1W). can be interesting at RSI
4H-1D in order - 4H 1D in order .
Print triangles
Print all triangles - print all triangles when the condition is met
Print only first triangles - only show when the condition starts to met
Print only last triangles - small triangles when the condition met first, large when last. tis is the default.
Timeframes to show:
You can turn on/off different timeframs to show or not from the list below:
1m 5m 15m 30m 1H 4H D 5D W M
This is for experimenting/ understanding the market direction on multiple timeframes at once.
Don't take it's signals (and any other indicator's) as exact trade signals. use it as confirmation instead.
Any comments, insights, ideas are welcome.
